
Instrumenting Your MCP Server
Instrumenting Your MCP Server
So you’re on the MCP hype train, eh? I’m not here to dissuade you from shooting your shot, but let’s make sure you’ve got your bases covered in production when something inevitably goes wrong. This focus will be on utilizing Sentry for errors, traces, and logs, and if you want to use another service, well I can’t stop you from making bad decisions. We’re only going to cover TypeScript, but the patterns apply to the Python implementations as well.
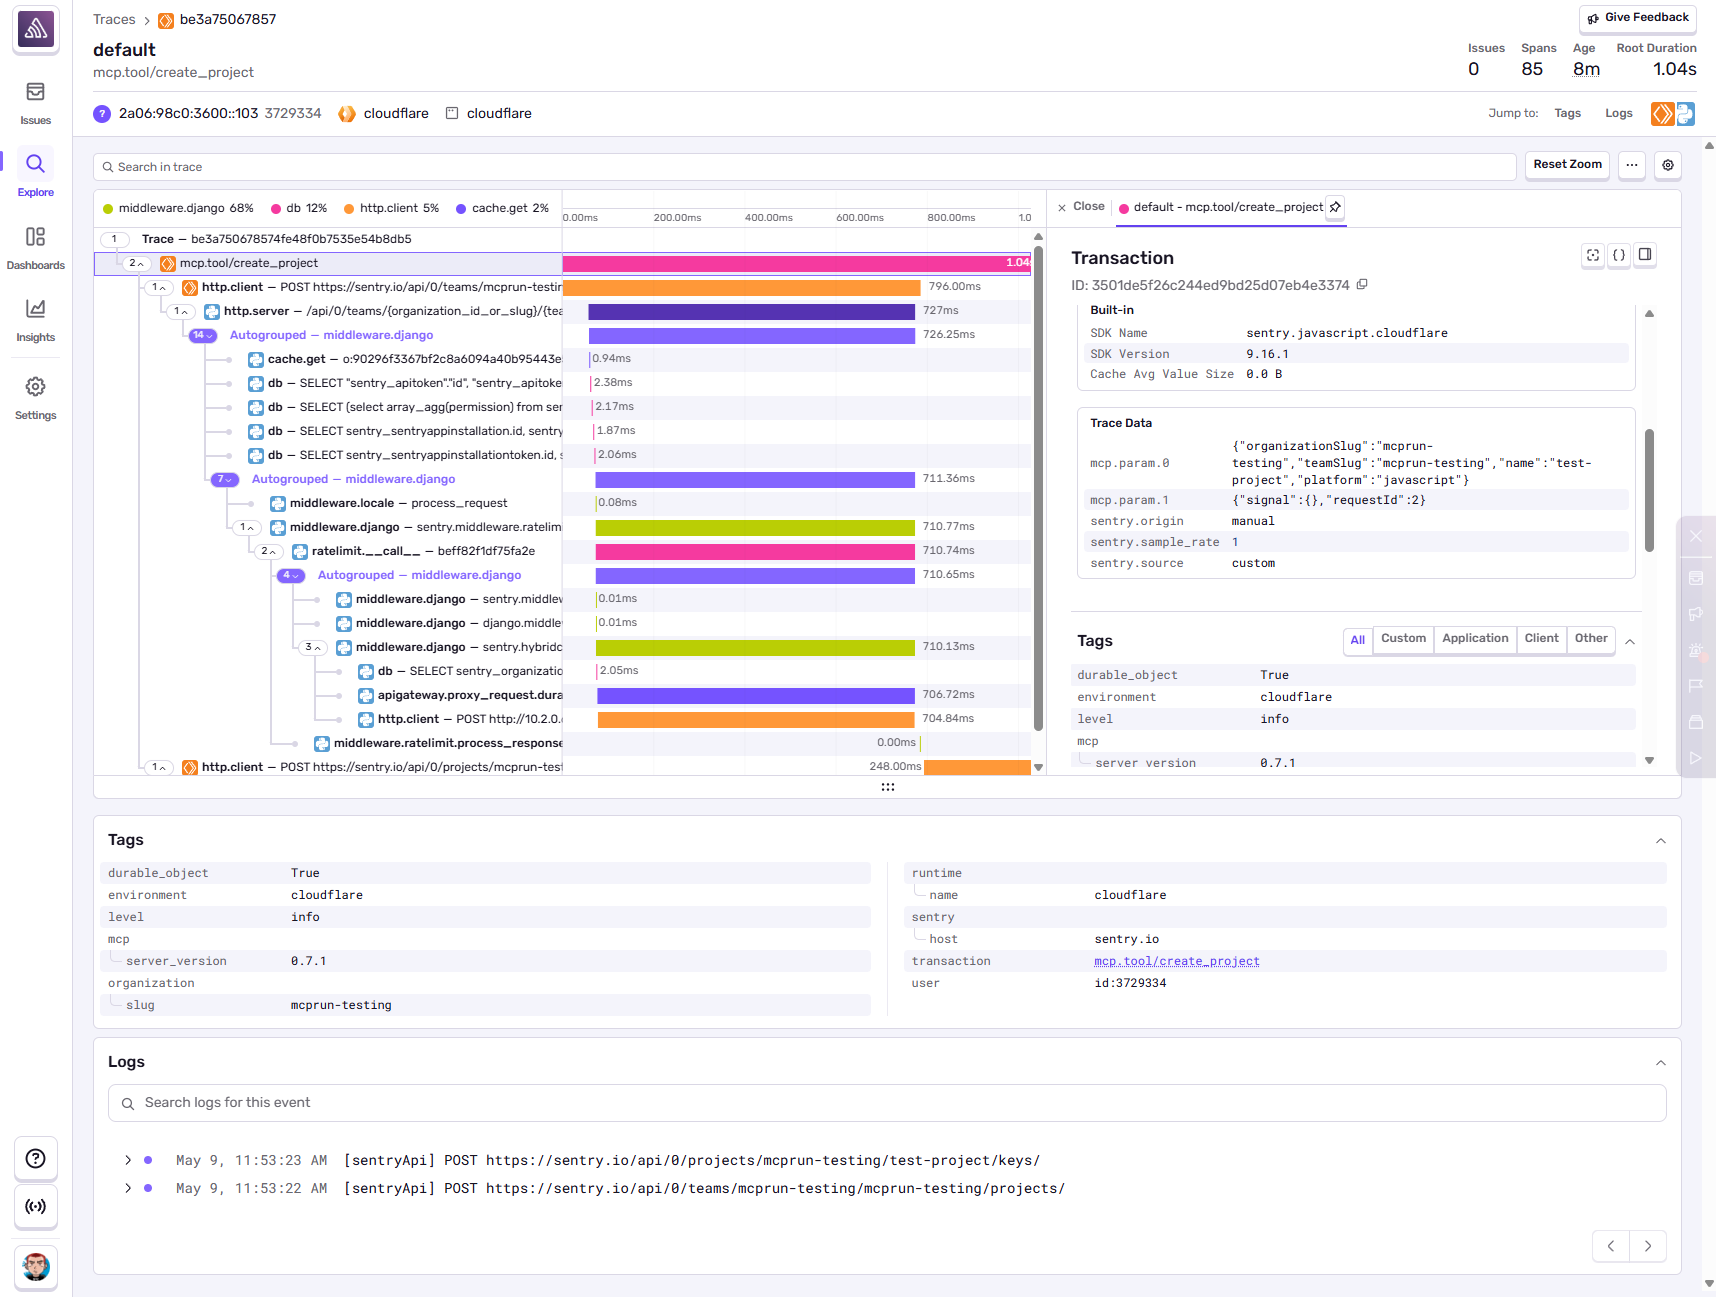
tl;dr this could be you
I’m going to try to be succinct here, but will also be covering a large chunk of concerns. Feel free to jump ahead if you half-way know what you’re doing.
- An overview of instrumentation for the
modelcontextprotocolserver - Getting Sentry working
- Better error handling
- Context is king
- Tracing tool calls et all
- Gotchas between stdio and remote
One thing to keep in mind: we’ll be contextualizing the conversation around Cloudflare’s remote-mcp-github-oauth demo application. That means we’ll also be covering Cloudflare-specific quirks when working with their agents SDK.
For a more feature complete (and more complex) example, take a look at Sentry’s mcp-server implementation. It includes everything we’re talking about, as well as covering some additional production-ready concerns like utilizing Evals in CI.
#An Overview
We’re not going to cover SSE-vs-Streaming, nor are we going to cover OAuth. In our example we’re expecting that you’re plugging into an existing authentication provider using Cloudflare’s intermediary. We’re also assuming that the differences between SSE and Streaming are outside of the scope for these concerns. With that said, here’s where you’re going to want to end up with a production-ready service:
- Any error a user experience gets propagated upstream
- Baseline tracing exists to enable broader debugging
- Everything is trace-connected (errors, logs, and spans)
- Traces will propagate to your existing systems if they’re instrumented
In that, we’re going to focus on two modes of operation:
- Remote - the transport which is remotely connected to via SSE or HTTP Streaming. This is locked behind an OAuth flow, and is what is implemented in the
remote-mcp-github-oauthdemo application. - Stdio - the transport which is run locally on an end-users machine, or in Sentry’s case, we also use it within our test suite. This requires a user explicitly pass a Personal Access Token (PAT) to the server.
The focus will also be on instrumentation of tool calls, as those are the primary concern for most implementations. Many of the techniques we’re applying can be cleanly duplicated across other concerns (at the very, easily for things like prompts and resources). Our main goal is to understand when those fail, but a secondary concern is identifying utilization of the system.
Lastly, and most importantly, this is focused on doing this within Cloudflare’s environment. While most of the behavior is similar or identical in other environments, Cloudflare requires a bit of additional work to ensure Sentry works correctly within the context of a Worker or Durable Object.
So let’s get started. Grab your MCP codebase, or pull down remote-mcp-github-oauth or mcp-server to follow along.
If you choose to take Sentry’s for inspiration, you’ll want to primarily look in the mcp-server and mcp-cloudflare packages.
#Bootstrap Sentry
The first concern we always have is going to be errors. If you’re from this planet its likely you regularly ship bugs to production. Its also likely you’re not going to be logging into your server or some console to watch the stream of logs hoping to find anything of important. So let’s get that setup, because that is the baseline to enable additional instrumentation (including tracing).
Generally speaking instrumentation of Sentry is easy, and its not too different for MCP:
import * as Sentry from @sentry/node

Sentry.init({
    dsn: "..."
});
For Cloudflare initialization is a little more complex, and has to exist in multiple contexts:
- in your Worker definition
- in any Durable Object definition.
As of @sentry/javascript@9.16.0 we support both Workers and Durable Objects, so let’s get those going. Remember, every thing we’re referencing is within the remote-mcp-github-oauth repository.
For the sake of completeness, start by adding the @sentry/cloudflare dependency:
npm add @sentry/cloudflareOpen up index.ts, this is where we’re defining the Worker export:
export default new OAuthProvider({
  apiRoute: "/sse",
  apiHandler: MyMCP.mount("/sse"),
  defaultHandler: GitHubHandler,
  authorizeEndpoint: "/authorize",
  tokenEndpoint: "/token",
  clientRegistrationEndpoint: "/register",
});
Enabling Sentry here is pretty straightforward:
import * as Sentry from "@sentry/cloudflare";

// ...

const worker = new OAuthProvider({
  apiRoute: "/sse",
  apiHandler: MyMCP.mount("/sse"),
  defaultHandler: GitHubHandler,
  authorizeEndpoint: "/authorize",
  tokenEndpoint: "/token",
  clientRegistrationEndpoint: "/register",
});

export default Sentry.withSentry(
  (env) => ({
    dsn: env.SENTRY_DSN,
  }),
  worker,
) satisfies ExportedHandler<Env>;
Thats it for the Worker itself, but we’ll still need to instrument the Durable Object. This is the MyMCP class defined in the same file:
export class MyMCP extends McpAgent<Props, Env> {
  //...
}
Its important that we wrap the export, not just the implementation. This is a nuance of how Cloudflare works, but without it you’ll be missing instrumentation in some contexts.
class MyMCPBase extends McpAgent<Props, Env> {
  // ...
}

export const MyMCP = Sentry.instrumentDurableObjectWithSentry(
  (env) => {
    dsn: env.SENTRY_DSN,
  },
  MyMCPBase
);
You’ll note here that we’re duplicating the initialization call of Sentry, which means we’re duplicating config. Let’s clean that up a bit as it’ll help us later:
import * as Sentry from "@sentry/cloudflare"

function getSentryConfig(env: Env) {
  return {
    dsn: env.SENTRY_DSN,
  };
}

// ...

export const MyMCP = Sentry.instrumentDurableObjectWithSentry(
  getSentryConfig,
  MyMCPBase
);

// ...

export default Sentry.withSentry(
  getSentryConfig
  worker,
) satisfies ExportedHandler<Env>;
Great! We’ve got some baseline instrumentation here. Its not enough though. If an error happens within a tool call it won’t actually propagate up to Sentry’s error handler.
#Error Handling
In some applications you may just want to throw an error and let the web server handle it. In an MCP Server that’s not enough. For many errors its important to propagate up a LLM-usable response, as it gives the agent more context and allows them to possible work around the problem.
A really good example of this is a typical Bad Request error. Let’s tweak the GitHub MCP example and add a divide tool:
this.server.tool(
  "divide",
  "Divide two numbers the way only MCP can",
  { a: z.number(), b: z.number() },
  async ({ a, b }) => ({
    content: [{ type: "text", text: String(a / b) }],
  }),
);
There’s a pretty obvious error scenario that’ll exist here now: passing in a 0 for either parameter. Depending on your runtime itll throw various errors, but in JavaScript it simply returns Infinity. That’s not what we want! The right way to resolve this would be to expand the zod validators here (assert they’re not zero), but for the sake of this example let’s avoid that. Instead we’re going to handle errors:
this.server.tool(
  "divide",
  "Divide two numbers the way only MCP can",
  { a: z.number(), b: z.number() },
  async ({ a, b }) => {
    const result = a / b;
    if (typeof result !== "number") {
      return {
        content: [
          {
            type: "text",
            text: "The result was not a number, did you try dividing by zero?",
            isError: true,
          },
        ],
      };
    }
    return {
      content: [
        {
          type: "text",
          text: String(result),
        },
      ],
    };
  },
);
The real world is obviously messier than this, so we don’t alway sknow what errors are going to happen. To work around that let’s abstract our error handling:
import * as Sentry from "@sentry/cloudflare";

function handleError(err: unknown) {
  const eventId = Sentry.captureException(error);

  return [
    "**Error**",
    "There was an problem with your request.",
    "Please report the following to the user:",
    `**Event ID**: ${eventId}`,
    process.env.NODE_ENV !== "production"
      ? error instanceof Error
        ? error.message
        : String(error)
      : "",
  ].join("\n\n");
}
This will do a few things:
- It’ll respond with an LLM-safe message, albeit one that is generic.
- It’ll return a Sentry Event ID to the user, which you can use to look up any reported problems.
- If you’re running in a development environment, it’ll respond with the raw error.
You can continue to expand on this abstraction, but the first step is to use it:
this.server.tool("echo", { message: z.string() }, async ({ message }) => {
  try {
    return {
      content: [{ type: "text", text: `Tool echo: ${message}` }],
    };
  } catch (err) {
    return handleError(err);
  }
});
From there I’d recommend looking for common errors, such as API errors, and returning a specialized response. Here’s an example from Sentry’s service on how I’m managing this:
function isApiError(error: unknown) {
  return error instanceof ApiError || Object.hasOwn(error as any, "status");
}

async function logAndFormatError(error: unknown) {
  if (isApiError(error)) {
    const typedError = error as ApiError;
    return [
      "**Error**",
      `There was an HTTP ${typedError.status} error with the your request to the Sentry API.`,
      `${typedError.message}`,
      `You may be able to resolve the issue by addressing the concern and trying again.`,
    ].join("\n\n");
  }

  const eventId = Sentry.captureException(error);

  return [
    "**Error**",
    "It looks like there was a problem communicating with the Sentry API.",
    "Please report the following to the user for the Sentry team:",
    `**Event ID**: ${eventId}`,
    process.env.NODE_ENV !== "production"
      ? error instanceof Error
        ? error.message
        : String(error)
      : "",
  ].join("\n\n");
}
Great! We’ve got a baseline. Now we can move on to more complex instrumentation.
Note: We’ll be improving this with Sentry in the future with a formal MCP wrapper that automatically propagate errors for you, but it currently isn’t working on Cloudflare.
#Lets Talk Context
Sentry is superior than other products for one primary reason: context. The instrumentation we did above gives you a baseline, which is a great start, but it doesnt take full advantage of the debuggability workflows we bring. Lets talk about some of the kinds of context I typically reach for, in the shape of questions I have for data:
- Who is this problem affecting? This comes in both person and company form.
- Where is it happening? Typically this is in the form of the ‘transaction’ (e.g. url, or the tool call).
- What’s the scope of the problem? This gets pretty variable, but an example might be which upstream agent is triggering it?
To enable these flows we’re going to bind some baseline context within our MCP. For Sentry’s server, with some of the above goals, we bind context for the following:
user.id:user.ipis also a valuable, but less useful substituteorganization.slug: this tells us which organization they’re querying againstclient.id: our OAuth client_id, helping us root cause authorization issuestool.name: in the scope of MCP, this is more important than the URL (as the URL is always the same)tool.parameters: the input parameters to the tool call - vital when debugging errorsfetch: the urls downstream that we’re querying, which are construct by our API client.
We’re instrumenting these in different ways, and a bunch will come from our tracing config, so let’s focus on the broader context first. First, lets grab the session data. In our context this is user.id, and client.id.
Take a look at github-handler.ts and you’ll find we’re binding some context which will get passed into the MCP server. Specifically we’re looking at the /callback flow::
// Return back to the MCP client a new token
const { redirectTo } = await c.env.OAUTH_PROVIDER.completeAuthorization({
  request: oauthReqInfo,
  userId: login,
  metadata: {
    label: name,
  },
  scope: oauthReqInfo.scope,
  // This will be available on this.props inside MyMCP
  props: {
    login,
    name,
    email,
    accessToken,
  } as Props,
});
We’ve got some very useful information here. Specifically login is the GitHub username, and email is well, the email. Ideally you want both - email is particularly a useful dimension as it means you can reach out to a customer when they hit an issue. You’re going to use setUser in your tool calls for these:
this.server.tool("echo", { message: z.string() }, async ({ message }) => {
  Sentry.setUser({
    username: this.props.login,
    email: this.props.email,
  });

  // ...
});
Similar to the error handling example, we really dont want to be defining this on a per-function basis. The best way to do this is to create a helper for your tools, which can take care of both the error handling as well as a bunch of our context:
const registerTool = (server, name, schema, handler) => {
  // types are left as an exercise to the reader, glhf
  this.server.tool(name, schema, async (args) => {
    Sentry.setUser({
      username: this.props.login,
      email: this.props.email,
    });

    try {
      return await handler(args);
    } catch (err) {
      return handleError(err);
    }
  });
};

registerTool(
  this.server,
  "echo",
  { message: z.string() },
  async ({ message }) => {
    // ...
  },
);
Now we’ve got a helper function which will make instrumenting all tools much easier. There’s a lot more you can do beyond setUser, so let make show one simplistic example from Sentry’s implementation. Most of our endpoints require you to pass in an organizationSlug so we can identify the tenant you’re querying. That means we expose this parameter to our tools. We use Sentry’s tags behavior (via setTag) to capture that:
  list_teams: async (context, { organizationSlug }) => {
    setTag("organization.slug", organizationSlug);

     // ...
  },
This means any event happening after we call setTag will always have that information bound to it, the same as setUser. In some cases this may not be desirable, but we’re going to avoid that complexity for a moment.
To make this most effective for you, just think about what you’d need to debug a problem, or to identify the impact or scope of a concern, and then bind that context where it makes sense.
#Setting up Tracing
Time for the big one. Let me start by apologizing for how overwhelming tracing is. Its hard to keep it simple, and the industry certainly hasn’t helped. I’m going to give you the bare minimum to get up and running and find value in it. You may not find daily value in what most of the industry will sell your around tracing (diagnosing performance concerns), but we try to improve upon that in Sentry by ensuring all data is trace-connected. That means any data point you capture likely links to every other related data point. An error that happens inside of an instrumented trace (e.g. spans) will give you access to all of that surrounding context, in addition to giving you access to other relevant logs, session replays, etc. Thats a lot so lets just get into it.
First we’re going to go back to our Sentry initialization code, and its time to ramp up the complexity=:
import * as Sentry from "@sentry/cloudflare"

function getSentryConfig(env: Env) {
  return {
    // you can disable Sentry by setting SENTRY_DSN to a falsey-value
    dsn: env.SENTRY_DSN,

    // a sample rate of 1.0 means "capture all traces"
    tracesSampleRate: 1,

    // if you've got access to our logs beta, lets toss it in here for utility
    // _experiments: {
    //   enableLogs: true,
    // },
    integrations: [
      // coupled to our logs beta, this will give us `console.log` statements
      // automatically
      // Sentry.consoleLoggingIntegration(),
    ],
  };
}

// ...

export const MyMCP = Sentry.instrumentDurableObjectWithSentry(
  getSentryConfig,
  MyMCPBase
);

// ...

export default Sentry.withSentry(
  getSentryConfig
  worker,
) satisfies ExportedHandler<Env>;
The main thing you need to focus on here is tracesSampleRate. We give you a bunch of spans (a single unit within a trace) for free, but if you are operating a high volume service you may consider reducing this.
Now we’ve got the core configuration up and running we actually need to ensure traces are available. Traces require a few things to happen:
- Starting (or continuing) a trace. That is, creating a new
traceIDor continuing one from an upstream service. - A bunch of spans - think of these as structured logs. They’re just events with a
spanIDandparentSpanIDconcept. - Propagating the
traceID. We do this mostly automatically for you, but you have to ensure somehow the trace ID goes through all network (or IPC) bridges. For example, when you callfetch, we’ll automatically add the appropriate trace headers to it. - Flushing the data. Tracing can be a lot of data, so we buffer it and send it to Sentry once and a while. Generally this is done at the end of a request cycle.
We’re going to look at tracing from a few fronts. Let’s start with our core Worker. Remember: this is a responsible our OAuth flow as well as initiating the SSE or HTTP Streaming requests. Its this bit of code below:
export default Sentry.withSentry(
  getSentryConfig
  worker,
) satisfies ExportedHandler<Env>;
In this case the withSentry call is wrapping the internal Worker behavior, handling setting up the trace (1) as well as flushing the data (4). Additionally it is also handling creating a span for the initial HTTP request (2). Lastly, for propagation, we probably don’t need to worry about it for the sake of our example, as everything we’re doing is automatically instrumented by Sentry.
The MCP server however is the meat of our concer, and thats inside of the Durable Object:
export const MyMCP = Sentry.instrumentDurableObjectWithSentry(
  getSentryConfig,
  MyMCPBase,
);
This is similar to before, where instrumentDurableObjectWithSentry is handling the trace setup (1) as well as - to some degree - flushing the data (4). We’ve got some work to do from here.
Note: Sometime in the very near future, what I’m about to tell you will be obsolete, as we’ll be dropping a formal MCP integration that does this for you.
Let’s instrument the MCP server itself with tracing, and additional trace context. This is where that abstraction we built before helps. Let’s start by creating a new trace for every single tool call. This isnt ideal, but its also somewhat subjective. You may consider each call to your system a new trace, but you may also consider an entire session within an agent to be a trace. I’m not going to dive into that nuance right now, so we’re just going to treat every single tool call as its own entity.
const registerTool = (server, name, schema, handler) => {
  this.server.tool(name, schema, async (args) => {
    return await Sentry.startNewTrace(async () => {
      return await Sentry.startSpan(
        { name: `mcp.tool/${tool.name}` },
        async (span) => {
          Sentry.setUser({
            username: this.props.login,
            email: this.props.email,
          });

          try {
            return await handler(args);
          } catch (err) {
            span.setStatus({ code: 2 }); // error
            return handleError(err);
          }
        },
      );
    });
  });
};
We’re doing three key things in here:
startNewTracecreate a new tace for every single tool callstartSpancreates an initial span, calledmcp.tool/tool_name- Recording the status of the call (success/fail)
We can take this one step further though, and attach our parameters to our span to make debugging easier:
/**
 * Take the arguments from something like an MCP tool call and format
 * them in an OTel-safe way.
 */
const extractMcpParameters = (args: Record<string, any>) => {
  return Object.fromEntries(
    Object.entries(args).map(([key, value]) => {
      return [`mcp.param.${key}`, JSON.stringify(value)];
    }),
  );
};
Now augment our startSpan call to attach those attributes:
const registerTool = (server, name, schema, handler) => {
  this.server.tool(name, schema, async (args) => {
    return await Sentry.startNewTrace(async () => {
      return await Sentry.startSpan(
        {
          name: `mcp.tool/${tool.name}`,
          attributes: extractMcpParameters(args),
        },
        async () => {
          // ...
        },
      );
    });
  });
};
From here you could expand other parts of your stack with additional instrumentation. You only need to call startNewTrace once. In additional areas where you want to capture information you can simply use startSpan:
function someExpensiveThingYoureCalling() {
  return Sentry.startSpan(
    {
      name: "expensive/thing",
    },
    () => {
      // ...
    },
  );
}
Take a look at Sentry’s semantic conventions to ensure maximum compatibility if you’re going down the span rabbit hole.
#Stdio vs Remote
Still with me? There’s one last challenge we’ve got to work through, and that’s stdio. If you’re not shipping this transport you can safely ignore this section. Otherwise start with: everything I told you before, its slightly different now. Let’s reboot and just setup a baseline stdio transport with Sentry:
import { McpServer } from "@modelcontextprotocol/sdk/server/mcp.js";
import { StdioServerTransport } from "@modelcontextprotocol/sdk/server/stdio.js";
import * as Sentry from "@sentry/node";

Sentry.init({
  // ...
})

// you'll have to abstract your server in a way that's going to work both with Cloudflare and stdio
// but for the sake of this, we're keeping the example simple
const server = new McpServer(
    name: "My MCP",
    version: "0.1.0",
);
// reapply all the learnings we taught you above, glhf
server.tool("echo", { message: z.string() }, async ({ message }) => {
  // ...
});

const SENTRY_TIMEOUT = 5000; // 5 seconds

export async function startStdio(server: McpServer) {
  try {
    // start a new trace that runs _across the entire stdio session_
    // you can always do this per-tool call instead
    return await Sentry.startNewTrace(async () => {
      const transport = new StdioServerTransport();
      await server.connect(transport);
    });
  } finally {
    // When the server exits we need to ensure any buffered Sentry events
    // are sent upstream
    Sentry.flush(SENTRY_TIMEOUT);
  }
}

startStdio();
In @sentry/mcp-server you’ll find our entry point in packages/mcp-server/index.ts if you want to learn more.
There’s a lot of complexity that exists as soon as you want to support both the HTTP-based transports and the stdio mode. Its doable but you’re going to need additional abstractions. That complexity increases a bit within Cloudflare as you’re referencing this.props inside of the Durable Object implementation.
In Sentry’s MCP we have abstracted that into ServerContext - a config we pass into each MCP tool definition. That allows us to have uniformity between stdio and sse in our case. It also means we re-use all of our existing instrumentation.
There’s one other small gotcha when it comes to Sentry here. You need to be using @sentry/cloudflare for the Worker and Durable Object abstractions, @sentry/node for the stdio abstraction, but importantly you can use @sentry/core for any shared code. The runtime-specific packages will handle all of the runtime-specific concerns (usually registering hooks), but you can safely use the base package for any instrumentation within your shared code.
The last bit here comes from distributing your package on NPM. You likely want to grab errors, maybe traces, and send them up to your Sentry account. The best way to do this is to define a SENTRY_DSN value as part of your build process. We do this with tsdown:
import { defineConfig } from "tsdown";
import { readFileSync } from "node:fs";

const packageVersion =
  process.env.npm_package_version ??
  JSON.parse(readFileSync("./package.json", "utf-8")).version;

export default defineConfig({
  entry: ["src/**/*.ts"],
  format: ["cjs", "esm"], // Build for commonJS and ESmodules
  dts: true, // Generate declaration file (.d.ts)
  sourcemap: true,
  clean: true,
  env: {
    SENTRY_DSN:
      "https://d0805acebb937435abcb5958da99cdab@o1.ingest.us.sentry.io/4509062593708032",
    SENTRY_ENVIRONMENT: "stdio",
    SENTRY_RELEASE: packageVersion,
    npm_package_version: packageVersion,
  },
});
This information then gets passed into the stdio initialization call:
Sentry.init({
  dsn: process.env.SENTRY_DSN,
  release: process.env.SENTRY_RELEASE,
  environment: process.env.SENTRY_ENVIRONMENT,

  // ...
});
You’ll note we’re referencing two more core pieces of Sentry context here: release and environment. These are extremely useful in a lot of contexts, but they’re totally optional. I find it increasingly important for distributions because knowing which version a user is running is critical to even diagnosing if the bug is still valid. Additionally the environment value lets us differentiate between stdio and anything else (we use environment: "cloudflare" for our production instance).
#glhf
If you make it this far, I salute you. I know that was a lot, but hopefully its helpful. If you want to see real world examples of this take a look at our repository:
https://github.com/getsentry/sentry-mcp
We’re actively working on improving the story for Sentry within the context of Agents and MCP, as well as providing better native support for Cloudflare. My hope is that by the time you’ve read this we’ll have already simplified some of the boilerplate and removed a few of the gotchas.